Indicators of Soil Physical Properties

Here are several tests allowing to obtain an indicative result on the physical properties of a soil.
Physical properties of soil
Soil is a complex ecosystem in which interact the mineral and organic matrices, the liquid and gaseous fluids, macroscopic and microscopic organisms. All these elements can be measured by field tests or in the laboratory.
Standardized or not, these tests inform us about the biological aspect (microbial respiration, faunal abundance...), the physical aspect of the soil (texture, structural state, infiltration, resistance, water presence...) and the chemical aspect (acidity or alkalinity, carbon content, nitrogen content...).
The physical aspect of soil is a mixture of three phases: the solid phase ("the earth"), the liquid phase (free or bound water) and the gaseous phase. To analyze soil, we study:
- The granulometry (size of particles) and texture.
- The state and structural stability.
- The porosity.
- The mechanical properties such as cohesion or compaction.
- The water properties.
Texture
The arrangement of solid grains among themselves forms the soil skeleton. We can classify these solid particles according to their granulometry, their size. Thus, we distinguish fine particles from coarse elements.
| Fine
elements |
Clays | Less than 2 µm |
|---|---|---|
| Fine silts | From 2 to 20 µm | |
| Coarse silts | From 20 to 50 µm | |
| Fine sands | From 50 to 200 µm | |
| Coarse sands | From 200 to 2000 µm (2 mm) | |
| Coarse
elements |
Gravels | From 0.2 to 2 cm |
| Pebbles | From 2 to 5 cm | |
| Stones | From 5 to 20 cm | |
| Blocks | Greater than 20 cm |
Granulometric analyses are done only on the fine earth. Clays, silts and sands have different properties (Schwartz, n.d.):
- The clay content affects the water reserves and the exchangeable bases.
- The silt content plays an essential role in settling.
- Sands favor drainage, but are chemically inert.
After obtaining the percentages of clay, silt and sand, the soil texture can be identified using a texture triangle.

Structure
Soil particles can group together in the form of aggregates, held by a set of organic substances (the glomaline, exopolysaccharides) called the soil glue[1]. These aggregates can be classified by their size[2]:
- Macro-aggregates (greater than 250 μm).
- Micro-aggregates (from 20 to 250 μm).
Moreover, we can also classify them according to their arrangement mode: this is the structure. The structure defines many pedological parameters such as porosity (the volume of soil voids, occupied by water or gases), bulk density, infiltration properties...
The structural stability of a soil is "the ability of a horizon to maintain a good aggregation state when subjected to the sudden action of water"[3] such as rain, runoff or irrigation. It is a very important indicator to consider soil quality, its overall yield[2]. Indeed, a good maintenance of structure helps to reduce the negative effect caused by surface crusting, erosion or soil compaction.
Texture study
These methods allow to determine the soil texture (clayey, silty, sandy) and the particle diameter. These data support evaluating the impact of agricultural activity on soil quality, estimating the adsorption capacity of the soil regarding metals and organic substances, estimating the amount of suspended matter, the amount of sedimented matter and to determine the percentage of silt and clay contained in the soil.
Field tests
Field tests have the advantage of requiring no equipment, being easy to perform and free. However, they are not very precise as they only rely on the soil compactness.
Roll test
- Take a handful of moist soil and knead it until you get a roll.
- If the roll is flexible and malleable, it is a clayey soil. If the roll is fragile and breaks easily, it is a silty soil. If it is impossible to make a roll, it is a sandy soil.
Ball throwing test
- Take a handful of moist soil and press it to make a ball. Throw the ball in the air and catch it.
- If the ball disintegrates, the soil is poor and contains too much sand. If the ball remains formed, the soil is probably good and contains enough clay.
Pressure test
- Take a handful of soil and moisten it to bind the soil without it sticking to the hand. Press the soil then open the hand.
- If the soil keeps the handprint, then it contains a significant amount of clay. Otherwise, it contains a significant amount of sand.
Pie crust test
- Take a handful of moist soil. Roll it out using a bottle.
- The thickness' of the dough indicates the soil texture: less than 3 mm thick: clayey soil, 3 to 5 mm thick: ', and impossible to roll out the dough without breaking it: sandy soil.
Non-field or laboratory tests
These tests allow to determine the texture of the soil by classifying particles by diameter classes. Knowing the elements present in the soil helps to better understand the soil's capabilities.
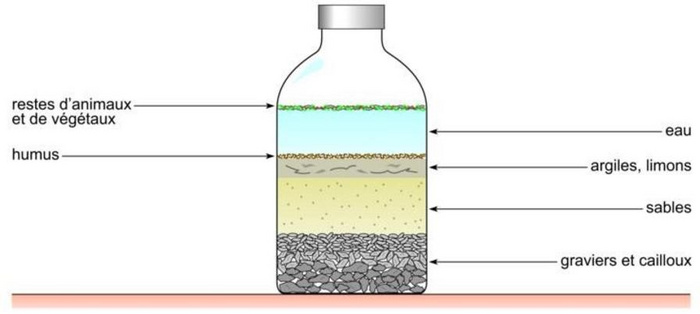
Jar method
Observation of the density of soil particles. This method is not feasible in the field because it is too long.
- Find a transparent jar with smooth edges. Fill half the jar with soil and fill the rest with water. Close the jar leaving some air. Shake for 3 minutes then let rest for 30 minutes. Then shake again for 3 minutes. Let rest for at least 24 hours so that the finest particles can settle.
- The observable layers in the jar have different thicknesses. By measuring these thicknesses, we can deduce the percentage of silt, clay and sand contained in the studied soil.
- The least dense particles: clay particles (fine earth). The most dense: particles of sand, pebbles, gravels. On the water surface float various plant debris.
Granulometric analysis by sieving
Sorting, by standard sieves, of coarse grains in the studied soil sample.
Equipment: A scale, a shaker, sieves of different sizes.
- For grains smaller than 80μm.
- Dry a known mass of soil and separate it by vibration on a series of stacked sieves (from the largest mesh to the finest mesh). Weigh the content of each sieve.
- Sorting, by standard sieves, of coarse grains in the studied soil sample. Cumulative curves of sieve residue (% of grains smaller than a given size) as a function of the decimal logarithm of size (granulometric curve).
- The method allows estimating the amount of suspended matter and the amount of sedimented matter.
Granulometric analysis by sedimentation
Measurement of the settling velocity of fine to very fine grains as a complement to sieving analysis. For grains between 80μm and 1μm.
Equipment: A shaker, a sedimentation cylinder, a hydrometer or densimeter and a thermometer.
- Introduce a dispersing agent. Mix the solution and soil using a shaker. Pour the suspension into a 1L sedimentation cylinder and add distilled water to have a total suspension of 1000 mL. Let the soil rest 16h to reach complete saturation. Mix 30 to 40s for a soil with coarse grains containing fines (aggregates composed of very small elements), and 1 to 5 min for fine-grained soils. Cap and shake the cylinder vigorously for 1 min then place it in a stable, vibration-free place. Note the start time of sedimentation. Measure the concentration and settling velocity of soil particles using a hydrometer after defined times. The cylinder must be inverted several times. Measure the temperature each time concentration is measured.
- Measure the settling velocity of fine to very fine grains. The maximum diameter of particles still in suspension is calculated by Stokes' law. Then, a granulometric curve can be established.
Laser diffraction granulometer
Measurement of the granulometric distributions of particles by measuring the angular variation of scattered light intensity when a laser beam passes through the dispersed particle sample.
Equipment: A laser diffraction granulometer and a computer.
- The sample to analyze is inserted into the sample feeder. It has a shaker and a pump, circulating the sample through a lentille located in the granulometer. Two laser beams are used during measurement.
- Measurement of the granulometric distributions of particles by measuring the angular variation of scattered light intensity when a laser beam passes through the dispersed particle sample. Histogram of distribution by granulometric class. Calculation of main parameters: mean diameter, dispersion, specific surface.
| Method | ||
|---|---|---|
| Sieving analysis | Obtains the true particle size.
Allows estimating the adsorption capacity of the soil regarding metals and organic substances. |
Does not consider the shape of the particle.
Particles agglomerated during drying can distort results. Expert level. |
| Sedimentation analysis | Precise.
Allows determining the percentage of silt and clay. |
Very long analysis.
Expert level. |
| Laser analysis | Good reproducibility.
Good spectral resolution. Allows determining the percentage of silt and clay. |
Limited by the wavelength of the laser beam and by the transparency of grains.
Expert level. |
| Jar method | Easy.
Low cost. Beginner level. |
Not precise. |
Structural state study
These methods allow to evaluate the physical fertility of a soil, to observe changes in soil structure linked to machine traffic (compaction, surface crusting, plough pan) and to observe rooting and water circulation. The goal is to help make tactical decisions, to anticipate the future effects of cropping and thus define an appropriate work itinerary for the soil type. Each parameter is assigned a score of 0, 1 or 2 (intermediate scores possible). Thus, an overall structural state score is assigned to the studied soil: satisfactory: above 25, average: from 10 to 25, and poor: below 10. These tests are done exclusively in the field.
Spade test
Equipment: A spade, a tarp and a meter.
- Empty a pre-trench to avoid compacting the block to observe when sampling it. Pre-cut the sides of the block to observe about 20 cm square with the spade. Insert the spade about 25 cm deep. Gently tilt the spade and carefully place it on the tarp.
Mini 3D profile
Intermediate method between the spade test and the cultural profile.
Equipment: A telescopic loader.
- Bring the 2 forks of the loader together with a spacing of 20 to 30 cm then fully insert the forks into the soil at an angle of 30 to 45°. Slightly lift without jolts then straighten the forks to avoid block collapse.
Cultural profile
Equipment: A spade or a mechanical shovel, a knife and a meter.
- Identify a representative area of the plot. Choose the profile dimensions and the observation face (to avoid any compaction during digging). Dig the pit and start observations.
| Method | ||
|---|---|---|
| Spade test | Easy to use.
Little equipment needed. |
Not very precise.
Difficult for: stony soils, too dry, very wet. |
| Mini profil 3D | Observation at eye level.
Low destructive. Simple. Fast. Better view of structure and rooting. |
Specific tool. Few samples possible. |
| Cultural profile | Observation at larger scale.
Low cost. |
Long (2/3 h per profile).
Restricted area. |
Structural stability study
These methods rely on observing the deterioration of a soil clod upon contact with water. They allow to evaluate the impact of agricultural activity on structure, thus to adapt agricultural practices, to evaluate the physical fertility of a soil and structure changes. The Bissonnais test and the aggregate stability kit require the use of a laboratory. The slake test is done exclusively in the field.
Slake test
Equipment: Containers, sieves and water.
- Fill small plastic containers with water. Insert a sieve inside. Place a soil clod on the sieve. Measure the speed at which the soil clod disintegrates.
- If the clod remains intact, the soil has very good structural stability, if it disintegrates completely, the soil has very poor structural stability.
Le Bissonnais test
This test determines if soil aggregates are stable under the sudden action of water in the different climatic, hydric and structural conditions that can be encountered at the soil surface.
Equipment: A spade, sampling boxes, sieves, an oven, ethanol.
- Sampling (aggregates collected for tests are between 3 and 5 mm), preparation and 3 treatments. The 3 treatments are rapid wetting by immersion, slow wetting by capillarity and mechanical disaggregation by agitation after rewetting. At the end of these treatments, a granulometric separation of fragments is performed (sieving in ethanol, sieving after drying).
- Results are either in the form of histograms (aggregate size distribution) or Weighted Mean Diameters (WMD). The average of WMDs provides a unique synthetic value. The ratios between the WMDs of different tests reveal the respective share of each mechanism.

Aggregate stability kit
Equipment: Sieves, a test system, a scale, a dispersant, cloths, demineralized water, a drying means.
- Take a soil sample. Pass it through a 2 mm sieve to recover fine elements. Determine the initial mass of each empty sieve (0.25 mm).
- Place 10 grams of soil noting the exact weight (P1). Place the sieves filled with soil on a damp cloth so that samples re-moisten by capillarity (for 5 minutes). Place the sieves inside the box then soak the samples in a bath of deionized or distilled water (vertical distance of 1.5 cm at 30 cycles per minute) for 3 minutes. After cycles, place the sieves on a dry cloth. Dry the samples using a hair dryer or oven (60°C for 24h). After drying, the weights of each sieve are recorded (P2).
- To determine the amount of sand, the sieves were immersed in 10g of Calgon dispersant solution for 5 minutes performing soaking cycles. Rinse samples until only primary particles remain. Place samples on a dry cloth then dry them. After drying, the weight of each sieve is recorded (P3).
- Percentage of water-stable aggregates = ((P2 - P3) / (P1 - P3)) x 100.
| Method | ||
|---|---|---|
| Slake test | Easy. Evaluates the impact of activity on soil structure. | |
| Le Bissonnais test | Expert level (comparison with standard samples).
To observe changes in soil structure (compaction, surface battance crust, plough pan). |
Does not indicate everything happening in situ.
To be combined with other tests (crusting, runoff and erosion tests). |
| Aggregate stability kit | Easy. Low cost.
In field or laboratory. To observe changes in soil structure (compaction, surface crust, plough pan). |
Not precise. |
Permeability study
These tests allow to determine the infiltration capacity of a soil. They help understand the hydrodynamic behavior of soils, in particular the onset of runoff, the infiltration capacity of surface horizons, subjected to different cropping systems, the permeability of underlying horizons, and to diagnose problems of erosion. These tests are done exclusively in the field.
Pit test (or Matsuo test)
Measurement of the flow discharged into the pit to maintain a constant water height.
Equipment: A backhoe or mini-excavator.
- Dig a pit of known dimensions. Fill it with water maintaining a constant water height.
- Measure first a flow rate Q1 (the flow needed to maintain the water height in the pit). Then extend the excavation by a certain length and measure again the flow rate Q2. The difference between the 2 measured flow rates is the flow absorbed by the additional excavation length. By extending the excavation, the influence of the ends is eliminated.
Beerkan Test
Measures the infiltration rate of water under moist and drained soil conditions.
Equipment: Water bottles, a PVC cylinder, a hammer, a wedge, a spade, a knife, scissors.
- On a flat surface, drive the cylinder 2 to 3 cm into the soil. Pour water (several iterations are necessary).
- Measure the infiltration time. Plot curves representing the cumulative infiltrated water as a function of infiltration time. The infiltration time progressively increases (the poured water fills the soil pores) then generally reaches a steady state (the water contained in the pores flows out). The infiltration rate must be calculated during the steady state.
- The shape of the wet spots provides information on differences in infiltration of successive horizons: risks of lateral drainage and the resistance of each horizon to infiltration.
Muntz Test (or conventional double ring method)
Measures the drop in water level in the inner ring to determine vertical permeability.
Equipment: A double ring system, a meter, 2 graduated cylinders with float systems.
- On a flat surface, drive the cylinders several centimeters into the soil. Fill the graduated cylinders (with float systems) with water and fill the central cylinder: water filling is done by breaking the jet to avoid any soil degradation.
- Start the stopwatch then quickly fill the second ring and continue measuring until a stable infiltration rate is obtained.
- Create a graph representing the volume of infiltrated water as a function of time: a flow rate is obtained when the curve becomes a straight line.
- Calculation is identical to the Porchet method (constant head). The only difference lies in the infiltration surface (water can only infiltrate through the bottom).
Porchet Method
Measures the drop in water level in a borehole (variable head) or in a graduated cylinder (constant head).
Equipment: A meter, a float or Mariotte bottle, a graduated cylinder, an auger.
- Dig a cylindrical hole of known diameter and depth. The depth depends on the soil type.
- After filling it with water, measure the infiltration rate for the variable head method. It is necessary beforehand to saturate the cavity walls with water to best meet the calculation assumptions (Darcy's law).
- Create a graph representing the volume of infiltrated water as a function of time: a flow rate is obtained when the curve becomes a straight line.
For the constant head method, first install a device to maintain a constant head (Mariotte bottle, float...) then fill the hole with water and verify that the head remains constant.
Guelph Permeameter
Measures the volume of water infiltrated over time (constant hydraulic head).
Equipment: A Guelph permeameter, an auger.
- Dig a cylindrical hole of known diameter and depth. Position the permeameter in the hole, the bottom must touch the bottom of the hole, then stabilize the tripod. Fill the permeameter with water and proceed with measurements.
- You obtain a water level (at the permeameter reservoirs) and a time. Calculate the difference in level (dh) and the difference in time (dt) between two measurements and calculate the ratio dh/dt. When the soil is saturated, the dh/dt ratio stabilizes.
- A second test must be performed, at the same location, at a different head, generally higher. The calculation determining the permeability takes into account the two tests.
| Method | ||
|---|---|---|
| Pit test | Simple.
Low cost. |
Not very precise. |
| Beerkan Test | Simple.
Reliable. Graphs easily interpretable. Compares cropping techniques on the plots. Quantifies and locates compaction zones. |
Long if clayey soil. |
| Muntz Test | Simple.
Graphs easily interpretable. No cavity excavation required. |
Requires a lot of water and time.
Not suitable for slopes >5%. Does not give the same soil ranking under natural rainfall conditions. |
| Porchet Method | Fast.
Low cost. With little equipment. |
Does not provide exact results in absolute value. |
| Guelph Permeameter | Light and durable equipment.
Can be operated by 1 person. |
Expert level |
Infiltration Test with PVC Tubes

This test proposed by Francis Bucaille allows measuring the water infiltration rate in soil, with the same principle as the Guelph infiltrometer but at lower cost. It allows evaluating soil permeability at different depths and adjusting agricultural practices based on results. If infiltration is too slow, interventions may be necessary to improve soil structure. Otherwise, soil tillage is not necessarily required.
Equipment: 2 PVC tubes of 160 mm diameter and about 15 cm length
Principle: simulate a heavy rain (30 mm) to see how fast water infiltrates and to what extent it risks stagnating between the plow pan and the soil surface:
- Surface test (standard): drive the first standard tube 3 or 4 cm into the soil and fill it with water to a height of 30 mm (i.e., about 60 cL of water). Water usually takes between 5 and 20 seconds to drain.
- Depth test: dig the soil to 20 to 35 cm depth, insert the tube, and fill it with water to a height of 30 mm (60 cL of water).
-
 Performing the infiltration test
 -
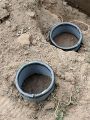


NB: to drive the tubes without breaking them, a metal ring can be placed (as in the photo) and a sacrificial wedge used.
If the water infiltration time into the soil is greater than 1 minute 30 seconds, then an intervention on the soil should be considered, for example fracturing it to allow water to evacuate faster.
This very simple test allows quick diagnosis of an hydromorphy problem.
Resistance Study
These tests determine the resistance of soils by determining the thickness and depth of different soil layers and performing compaction checks. These tests do not require a laboratory. Most methods are simple, fast, inexpensive and can be repeated.
Screwdriver Test
Measures penetration depth.
Equipment: A screwdriver.
- Insert a standard screwdriver into the soil.
- Depending on the hand position used to insert the tool to 10 cm, three results are observed:
- Soft soil: held between thumb and index finger.
- Medium-hard soil: held with full hand.
- Hard soil: held in a fist from above.
Hoe (Mattock) Test
Measures penetration depth.
Equipment: A hoe.
- Insert the tool into the soil so that it remains planted by itself after striking. Try to shear the soil.
- Depending on the body position during the test, several results are observed:
- Soft soil: test performed with one hand.
- Between soft and medium-hard soil: test performed with two hands.
- Medium-hard soil: test performed with one hand and bent legs.
- Between medium-hard and hard soil: test performed with two hands and bent legs.
- Hard soil: test impossible.
Penetration Test
Measures penetration depth.
Equipment: Smooth rods, a hammer.
- Drive a set of smooth rods with a known cross-section tip into the soil by hammering. Hammering is done by a mass falling from a known height.
- For a constant hammering energy, count the number of hammer blows corresponding to a given penetration of the rods into the soil. This purely empirical number can later be converted into a dynamic resistance depending on the type of penetrometer used.
Shear Test
Measures the shear stress at failure (or undrained cohesion) for soft purely cohesive soils (silt, peat, soft clay).
Equipment: A shear device (rod with two vertical blades of the same size and perpendicular to each other at the end). There are two other forms of this device: the laboratory shear device and the pocket shear device.
- Insert the shear device by a jack to the desired depth, then apply a torsion moment on the rod.
- Allows graphical representation of the shear stress in the soil as a function of the imposed rotation on the rotor or blade.
Pressuremeter Test
Equipment: A pressuremeter (a pressure/volume controller, a pressure probe and a connecting tubing), a gas reservoir.
Measures the radial expansion of a cylindrical probe in a borehole to determine the relationship between the pressure applied by the probe on the borehole walls and the displacement of the borehole walls.
- In a previously drilled borehole, insert a cylindrical probe at a known depth and perform the measurement.
- Take measurements at different depths. Three parameters are determined: the creep pressure, the limit pressure, and the pressuremeter deformation modulus.
- Allows obtaining a volumetric variation curve of the soil as a function of applied stress, and defining a stress-strain relationship of the in-situ soil.
| Method | ||
|---|---|---|
| Screwdriver Test | Information on the soil consistency before machine passage and on the soil shear resistance.
Beginner. |
Not very precise. |
| Hoe Test | Allows calculation of the soil cohesion.
Beginner. |
Not very precise. |
| Penetration | Several possible tests of static CPT penetration, dynamic DPT, split spoon SPT. | Expert. |
| Shear test | Not suitable for unsaturated soils, highly permeable soils or fissured clays.
Expert. | |
| Pressure test | Provides information on the soil rheology. | Device delicate to handle.
Only a spot reconnaissance (every meter at best). Long execution time. Measurement quality depends on borehole quality. Expert. |
Water Presence Study
These methods allow choosing the type of irrigation based on soil moisture. The last one (with the tensiometer) allows studying subsoil pollution and better adjust fertilizer dosing.
Tactile Test
Assess the soil moisture status by touch. In the field.
- Take a handful of soil and knead it with fingertips.
- Five categories are observed to qualify the soil:
- Dry: No detectable moisture.
- Fresh.
- Moist: Malleable sample, moisture near field capacity.
- Very moist.
- Saturated: Presence of free water.
Gravimetric Method
Determines the weight content of dry matter and water in a soil: measurement of the mass difference before and after heating. In laboratory.
Equipment: An oven, a desiccator, an analytical balance, a non-absorbent container, a spoon.
- Place a known mass of soil in a previously dried and weighed container. Determine the mass of the sample and container (m1). Place everything in an oven at 105°C until a constant mass is obtained. Let the container cool in a desiccator for at least 45 minutes. Other drying methods can be used (non-standardized): drying by infrared, drying by halogen source, microwave drying.
- Determine the mass of the container (m2).
- At the end, obtain the dry matter content and the gravimetric water content. Beware of systematic errors when the sample is hygroscopic and absorbs moisture from the air after drying and before weighing.
Neutron Probe Method
Measures moisture based on moderation of fast neutrons by hydrogen atoms. In the field.
Equipment: An auger, a neutron probe (an access tube, a counter, a fast neutron source and a thermal neutron detector).
- Install an access tube (4 to 5 cm diameter), closed at its lower end, in the soil. Lower the neutron probe into the access tube.
- Measure the flux of thermal neutrons.
- At the end, obtain the slow neutron density.
Richards Method or Membrane Press Method
Extraction of water contained in a soil sample subjected to a determined pressure in a closed chamber. In laboratory.
Equipment: An extraction chamber, a pipette, beakers, a compressed air bottle, an oven, a balance.
- Presses have different characteristics depending on the pressures they can withstand. There are high-pressure presses (P>3 bars) and low-pressure presses (P<3 bars). There are also plate presses and membrane presses.
- On the porous porcelain plate, place rings to retain the soil and pour soil samples into these rings and level. Add demineralized water on the porcelain plates placed in a saturation tray. Soak samples by capillarity and let excess water stagnate on the porcelain plates. Leave until the next day.
- After 24h, remove excess water from the porcelain plates with a pipette or syringe. Mount the porcelain plates in the extraction chamber and connect water evacuation tubes inside. Seal the extractor by tightening the lid nuts. Connect a rubber collector tube to the external evacuation tubes and lead them together into a glass beaker to collect extracted water. Open the collector regulation valve. Open the compressed air bottle until the correct pressure is reached in the device. Leave under pressure for 48h. Do not forget to close the ends of evacuation tubes to prevent water from rising after pressure release.
- Quickly transfer samples into previously weighed and numbered beakers. Weigh them with wet soil. Place them in an oven for 24h. Weigh the beakers containing dried soil.
- At the end, obtain the water content corresponding to water retention of the samples.
TDR Method
Measures the propagation time in soil of a high-frequency electromagnetic wave. In the field.
Equipment: A reflectometer (signal generator, waveguide, coupler, oscilloscope, sampler), an auger.
- Insert the two metal rods of the TDR device into the soil and take a measurement.
- The signal generator emits a step-type pulse that propagates via a coaxial cable along the waveguides made of parallel metal rods. Upon reaching the end of the guides, the wavefront is reflected and returns to the oscilloscope which records signal amplitude variations over time, at the start of the cable.
- Research projects aim to obtain, from a single time-domain reflectometry measurement, a soil water profile rather than a single average point measurement. Wave propagation time varies according to the soil's relative permittivity. The measured soil permittivity depends on the permittivities of its constituents (air, mineral particles, water). Since water dominates, it is the relative water content that determines the overall or effective soil permittivity. Calibration relates this to soil volumetric water content.
Measurement Method with Porous Candle Tensiometer
Determines soil suction by sampling soil solution using porous ceramic lysimeters. In the field.
Equipment: A porous candle tensiometer with vacuum gauge, a manual vacuum pump, an auger, bottles, a beaker, demineralized water.
- Fill the tensiometer with slightly colored water. Suspend the tube out of water for a few minutes. Immerse the tensiometer in the same colored water to submerge the porous candle completely. Using the manual vacuum pump, draw water into the tensiometer to a height of 3 to 4 mm in the tube. Complete filling the tube ensuring no gas bubbles are trapped. Seal the tube with a stopper. Check the pressure value on the gauge. Place the porous candle in the soil and take measurements.
- Initially, water in the tensiometer is at atmospheric pressure. In the soil, water films around particles in contact with the porous candle also develop on this part of the tensiometer. When the soil dries, water films become thinner and more limited. The tensiometer in the field constantly maintains equilibrium between the soil water matric potential and the water potential in the tube.
| Method | ||
|---|---|---|
| Tactile Test | Simple.
Free. Fast. |
Not precise. |
| Gravimetric Method | A large number of samples can be analyzed simultaneously.
Low cost. Easy. |
Long measurements.
Systematic errors (due to air humidity). |
| Neutron Probe Method | Fast and non-destructive measurements.
Intermediate level. |
Requires calibration for each site/horizon.
Device poorly suited to detect sharp moisture fronts. Measurements are delicate near soil surface. Emits radioactive waves. |
| Richards Method |
Expensive equipment. Dangerous handling. Expert. | |
| TDR Method | Simple.
Good accuracy. Can be automated and repeated for continuous analyses. |
Expert. |
| Method with tensiometer | Precise. | Expert. |
A still partial vision
To determine the overall quality of a soil, the analysis of a single indicator is not relevant. Indeed, the soil is a very complex environment and in constant interaction with the surrounding ecosystem. It is therefore perfectly logical to reason on a larger scale by looking at several indicators at once, including indicators on soil biology, on physical properties, and on chemical properties.
A soil analysis can also be carried out by experts. There is, for example, a methodology developed by researchers from IRD and Cirad to assess soil health by studying their biological activity: Biofunctool®. This method is based on a multi-criteria evaluation of the three essential functions for soil life and its organisms: carbon dynamics, the nutrient cycle, and the maintenance of soil structure.
This analysis can be carried out either by experts from Cirad and IRD (within the framework of services or research and development projects), or by agronomy experts who have received training (2023).
Sources
INRAE, SOLAE, Mégane PEREZ (2021), Contribution to the appropriation and generalization of the use of soil quality evaluation indicators in Provence – Alpes – Côte d’Azur, rd-agri, https://opera-connaissances.chambres-agriculture.fr/doc_num.php?explnum_id=163817