Triple Performance makes it easy to insert graphics into the pages, for example to show a rotation over several years, to show the details of an economic balance sheet or a crop rotation. Chart data is entered into a Google Spreadsheet™ document and then synchronized on the page using an Add-On.
Contents
Chart Types
It is possible to insert the following graphics:
Accounting
This graph allows you to display a simple economic assessment over several years. The colors make it possible to distinguish what is in the order of operational loads, structural loads, etc. By clicking on an area, you can see the details of what exactly constitutes the charges.
   "tooltip": {},
   "title": {
       "text": "Évolution du bilan financier",
       "subtext": "Cliquer sur une barre pour voir le détail",
       "textAlign": "center",
       "left": "50%"
   },
   "legend": {
       "bottom": "20",
       "type": "scroll",
       "selectedMode": "multiple"
   },
   "xAxis": {
       "type": "category",
       "data": [
           "2019",
           "2020",
           "2021",
           "2022"
       ]
   },
   "yAxis": {
       "type": "value",
       "axisLabel": {
           "formatter": "{value} €"
       }
   },
   "grid": {
       "containLabel": true
   },
   "series": [
       {
           "type": "bar",
           "itemStyle": {
               "color": "#afd095"
           },
           "label": {
               "show": true,
               "position": "inside",
               "formatter": "{c} €"
           },
           "emphasis": {
               "focus": "series"
           },
           "name": "Chiffre d'affaire",
           "stack": "Produits",
           "id": "Chiffre d'affaire",
           "data": [
               {
                   "groupId": "Produits",
                   "value": 450000
               },
               {
                   "groupId": "Produits",
                   "value": 361000
               },
               {
                   "groupId": "Produits",
                   "value": 528000
               },
               {
                   "groupId": "Produits",
                   "value": 598000
               }
           ]
       },
       {
           "type": "bar",
           "itemStyle": {
               "color": "#729fcf"
           },
           "label": {
               "show": true,
               "position": "inside",
               "formatter": "{c} €"
           },
           "emphasis": {
               "focus": "series"
           },
           "name": "Aides",
           "stack": "Produits",
           "id": "Aides",
           "data": [
               {
                   "groupId": "Produits",
                   "value": 76000
               },
               {
                   "groupId": "Produits",
                   "value": 107000
               },
               {
                   "groupId": "Produits",
                   "value": 55000
               },
               {
                   "groupId": "Produits",
                   "value": 63000
               }
           ]
       },
       {
           "type": "bar",
           "itemStyle": {
               "color": "#F28960"
           },
           "label": {
               "show": true,
               "position": "inside",
               "formatter": "{c} €"
           },
           "emphasis": {
               "focus": "series"
           },
           "name": "Charges opérationnelles",
           "stack": "Charges",
           "id": "Charges opérationnelles",
           "data": [
               {
                   "groupId": "Charges",
                   "value": 90240
               },
               {
                   "groupId": "Charges",
                   "value": 85760
               },
               {
                   "groupId": "Charges",
                   "value": 96800
               },
               {
                   "groupId": "Charges",
                   "value": 118720
               }
           ]
       },
       {
           "type": "bar",
           "itemStyle": {
               "color": "#F5A893"
           },
           "label": {
               "show": true,
               "position": "inside",
               "formatter": "{c} €"
           },
           "emphasis": {
               "focus": "series"
           },
           "name": "Charges de structure",
           "stack": "Charges",
           "id": "Charges de structure",
           "data": [
               {
                   "groupId": "Charges",
                   "value": 237000
               },
               {
                   "groupId": "Charges",
                   "value": 233720
               },
               {
                   "groupId": "Charges",
                   "value": 272000
               },
               {
                   "groupId": "Charges",
                   "value": 279360
               }
           ]
       },
       {
           "type": "bar",
           "itemStyle": {
               "color": "#FDCF74"
           },
           "label": {
               "show": true,
               "position": "inside",
               "formatter": "{c} €"
           },
           "emphasis": {
               "focus": "series"
           },
           "name": "Charges de personnel",
           "stack": "Charges",
           "id": "Charges de personnel",
           "data": [
               {
                   "groupId": "Charges",
                   "value": 8000
               },
               {
                   "groupId": "Charges",
                   "value": 7000
               },
               {
                   "groupId": "Charges",
                   "value": 16000
               },
               {
                   "groupId": "Charges",
                   "value": 20000
               }
           ]
       },
       {
           "type": "bar",
           "itemStyle": {
               "color": "#F8B26D"
           },
           "label": {
               "show": true,
               "position": "inside",
               "formatter": "{c} €"
           },
           "emphasis": {
               "focus": "series"
           },
           "name": "Soldes de gestion",
           "stack": "Charges",
           "id": "Soldes de gestion",
           "data": [
               {
                   "groupId": "Charges",
                   "value": 190760
               },
               {
                   "groupId": "Charges",
                   "value": 191520
               },
               {
                   "groupId": "Charges",
                   "value": 248200
               },
               {
                   "groupId": "Charges",
                   "value": 292920
               }
           ]
       }
   ]
} "2019": {
"Produits": {
"name": "Produits 2019\n526000 €",
"value": 526000,
"type": "treemap",
"breadcrumb": {
"height": 34,
"itemStyle": {
"textStyle": {
"lineHeight": 15
}
}
},
"data": [
{
"name": "Chiffre d'affaire\n450000 €",
"value": 450000,
"label": {
"show": true,
"position": "inside",
"overflow": "break"
},
"children": [
{
"name": "Vente de produits végétaux",
"value": 450000,
"label": {
"show": true,
"position": "inside",
"overflow": "break"
},
"children": []
}
],
"itemStyle": {
"color": "#afd095",
"borderWidth": 1
}
},
{
"name": "Aides\n76000 €",
"value": 76000,
"label": {
"show": true,
"position": "inside",
"overflow": "break"
},
"children": [
{
"name": "DPU, DPB",
"value": 48000,
"label": {
"show": true,
"position": "inside",
"overflow": "break"
},
"children": []
},
{
"name": "Aides",
"value": 25000,
"label": {
"show": true,
"position": "inside",
"overflow": "break"
},
"children": []
},
{
"name": "Aide à la certification",
"value": 3000,
"label": {
"show": true,
"position": "inside",
"overflow": "break"
},
"children": []
}
],
"itemStyle": {
"color": "#729fcf",
"borderWidth": 1
}
}
]
},
"Charges": {
"name": "Charges 2019\n526000 €",
"value": 526000,
"type": "treemap",
"breadcrumb": {
"height": 34,
"itemStyle": {
"textStyle": {
"lineHeight": 15
}
}
},
"data": [
{
"name": "Charges opérationnelles\n90240 €",
"value": 90240,
"label": {
"show": true,
"position": "inside",
"overflow": "break"
},
"children": [
{
"name": "Semences et plants",
"value": 23360,
"label": {
"show": true,
"position": "inside",
"overflow": "break"
},
"children": []
},
{
"name": "Fertilisation",
"value": 24160,
"label": {
"show": true,
"position": "inside",
"overflow": "break"
},
"children": []
},
{
"name": "Produits de traitements",
"value": 33600,
"label": {
"show": true,
"position": "inside",
"overflow": "break"
},
"children": []
},
{
"name": "Travaux par tiers",
"value": 9120,
"label": {
"show": true,
"position": "inside",
"overflow": "break"
},
"children": []
}
],
"itemStyle": {
"color": "#F28960",
"borderWidth": 1
}
},
{
"name": "Charges de structure\n237000 €",
"value": 237000,
"label": {
"show": true,
"position": "inside",
"overflow": "break"
},
"children": [
{
"name": "Carburant",
"value": 17280,
"label": {
"show": true,
"position": "inside",
"overflow": "break"
},
"children": []
},
{
"name": "Entretien matériel",
"value": 14560,
"label": {
"show": true,
"position": "inside",
"overflow": "break"
},
"children": []
},
{
"name": "Eau, gaz, électricité",
"value": 1000,
"label": {
"show": true,
"position": "inside",
"overflow": "break"
},
"children": []
},
{
"name": "Frais de gestion",
"value": 9000,
"label": {
"show": true,
"position": "inside",
"overflow": "break"
},
"children": []
},
{
"name": "Fermage",
"value": 36480,
"label": {
"show": true,
"position": "inside",
"overflow": "break"
},
"children": []
},
{
"name": "Assurances",
"value": 29120,
"label": {
"show": true,
"position": "inside",
"overflow": "break"
},
"children": []
},
{
"name": "Autres",
"value": 129560,
"label": {
"show": true,
"position": "inside",
"overflow": "break"
},
"children": []
}
],
"itemStyle": {
"color": "#F5A893",
"borderWidth": 1
}
},
{
"name": "Charges de personnel\n8000 €",
"value": 8000,
"label": {
"show": true,
"position": "inside",
"overflow": "break"
},
"children": [
{
"name": "Salariés",
"value": 8000,
"label": {
"show": true,
"position": "inside",
"overflow": "break"
},
"children": []
}
],
"itemStyle": {
"color": "#FDCF74",
"borderWidth": 1
}
},
{
"name": "Soldes de gestion\n190760 €",
"value": 190760,
"label": {
"show": true,
"position": "inside",
"overflow": "break"
},
"children": [
{
"name": "Prélèvements privés",
"value": 50000,
"label": {
"show": true,
"position": "inside",
"overflow": "break"
},
"children": []
},
{
"name": "Annuité de remboursement",
"value": 40000,
"label": {
"show": true,
"position": "inside",
"overflow": "break"
},
"children": []
},
{
"name": "Frais financiers",
"value": 10000,
"label": {
"show": true,
"position": "inside",
"overflow": "break"
},
"children": []
},
{
"name": "EBE total",
"value": 90760,
"label": {
"show": true,
"position": "inside",
"overflow": "break"
},
"children": []
}
],
"itemStyle": {
"color": "#F8B26D",
"borderWidth": 1
}
}
]
}
},
"2020": {
"Produits": {
"name": "Produits 2020\n468000 €",
"value": 468000,
"type": "treemap",
"breadcrumb": {
"height": 34,
"itemStyle": {
"textStyle": {
"lineHeight": 15
}
}
},
"data": [
{
"name": "Chiffre d'affaire\n361000 €",
"value": 361000,
"label": {
"show": true,
"position": "inside",
"overflow": "break"
},
"children": [
{
"name": "Vente de produits végétaux",
"value": 361000,
"label": {
"show": true,
"position": "inside",
"overflow": "break"
},
"children": []
}
],
"itemStyle": {
"color": "#afd095",
"borderWidth": 1
}
},
{
"name": "Aides\n107000 €",
"value": 107000,
"label": {
"show": true,
"position": "inside",
"overflow": "break"
},
"children": [
{
"name": "Subventions",
"value": 30000,
"label": {
"show": true,
"position": "inside",
"overflow": "break"
},
"children": []
},
{
"name": "DPU, DPB",
"value": 49000,
"label": {
"show": true,
"position": "inside",
"overflow": "break"
},
"children": []
},
{
"name": "Aides",
"value": 25000,
"label": {
"show": true,
"position": "inside",
"overflow": "break"
},
"children": []
},
{
"name": "Aide à la certification",
"value": 3000,
"label": {
"show": true,
"position": "inside",
"overflow": "break"
},
"children": []
}
],
"itemStyle": {
"color": "#729fcf",
"borderWidth": 1
}
}
]
},
"Charges": {
"name": "Charges 2020\n518000 €",
"value": 518000,
"type": "treemap",
"breadcrumb": {
"height": 34,
"itemStyle": {
"textStyle": {
"lineHeight": 15
}
}
},
"data": [
{
"name": "Charges opérationnelles\n85760 €",
"value": 85760,
"label": {
"show": true,
"position": "inside",
"overflow": "break"
},
"children": [
{
"name": "Semences et plants",
"value": 18080,
"label": {
"show": true,
"position": "inside",
"overflow": "break"
},
"children": []
},
{
"name": "Fertilisation",
"value": 30880,
"label": {
"show": true,
"position": "inside",
"overflow": "break"
},
"children": []
},
{
"name": "Produits de traitements",
"value": 28320,
"label": {
"show": true,
"position": "inside",
"overflow": "break"
},
"children": []
},
{
"name": "Travaux par tiers",
"value": 8480,
"label": {
"show": true,
"position": "inside",
"overflow": "break"
},
"children": []
}
],
"itemStyle": {
"color": "#F28960",
"borderWidth": 1
}
},
{
"name": "Charges de structure\n233720 €",
"value": 233720,
"label": {
"show": true,
"position": "inside",
"overflow": "break"
},
"children": [
{
"name": "Carburant",
"value": 9120,
"label": {
"show": true,
"position": "inside",
"overflow": "break"
},
"children": []
},
{
"name": "Entretien matériel",
"value": 21600,
"label": {
"show": true,
"position": "inside",
"overflow": "break"
},
"children": []
},
{
"name": "Eau, gaz, électricité",
"value": 2000,
"label": {
"show": true,
"position": "inside",
"overflow": "break"
},
"children": []
},
{
"name": "Frais de gestion",
"value": 8000,
"label": {
"show": true,
"position": "inside",
"overflow": "break"
},
"children": []
},
{
"name": "Fermage",
"value": 42000,
"label": {
"show": true,
"position": "inside",
"overflow": "break"
},
"children": []
},
{
"name": "Assurances",
"value": 32000,
"label": {
"show": true,
"position": "inside",
"overflow": "break"
},
"children": []
},
{
"name": "Autres",
"value": 119000,
"label": {
"show": true,
"position": "inside",
"overflow": "break"
},
"children": []
}
],
"itemStyle": {
"color": "#F5A893",
"borderWidth": 1
}
},
{
"name": "Charges de personnel\n7000 €",
"value": 7000,
"label": {
"show": true,
"position": "inside",
"overflow": "break"
},
"children": [
{
"name": "Salariés",
"value": 7000,
"label": {
"show": true,
"position": "inside",
"overflow": "break"
},
"children": []
}
],
"itemStyle": {
"color": "#FDCF74",
"borderWidth": 1
}
},
{
"name": "Soldes de gestion\n191520 €",
"value": 191520,
"label": {
"show": true,
"position": "inside",
"overflow": "break"
},
"children": [
{
"name": "Prélèvements privés",
"value": 50000,
"label": {
"show": true,
"position": "inside",
"overflow": "break"
},
"children": []
},
{
"name": "EBE total",
"value": 141520,
"label": {
"show": true,
"position": "inside",
"overflow": "break"
},
"children": []
}
],
"itemStyle": {
"color": "#F8B26D",
"borderWidth": 1
}
}
]
}
},
"2021": {
"Produits": {
"name": "Produits 2021\n583000 €",
"value": 583000,
"type": "treemap",
"breadcrumb": {
"height": 34,
"itemStyle": {
"textStyle": {
"lineHeight": 15
}
}
},
"data": [
{
"name": "Chiffre d'affaire\n528000 €",
"value": 528000,
"label": {
"show": true,
"position": "inside",
"overflow": "break"
},
"children": [
{
"name": "Vente de produits végétaux",
"value": 528000,
"label": {
"show": true,
"position": "inside",
"overflow": "break"
},
"children": []
}
],
"itemStyle": {
"color": "#afd095",
"borderWidth": 1
}
},
{
"name": "Aides\n55000 €",
"value": 55000,
"label": {
"show": true,
"position": "inside",
"overflow": "break"
},
"children": [
{
"name": "DPU, DPB",
"value": 52000,
"label": {
"show": true,
"position": "inside",
"overflow": "break"
},
"children": []
},
{
"name": "Aide à la certification",
"value": 3000,
"label": {
"show": true,
"position": "inside",
"overflow": "break"
},
"children": []
}
],
"itemStyle": {
"color": "#729fcf",
"borderWidth": 1
}
}
]
},
"Charges": {
"name": "Charges 2021\n633000 €",
"value": 633000,
"type": "treemap",
"breadcrumb": {
"height": 34,
"itemStyle": {
"textStyle": {
"lineHeight": 15
}
}
},
"data": [
{
"name": "Charges opérationnelles\n96800 €",
"value": 96800,
"label": {
"show": true,
"position": "inside",
"overflow": "break"
},
"children": [
{
"name": "Semences et plants",
"value": 20160,
"label": {
"show": true,
"position": "inside",
"overflow": "break"
},
"children": []
},
{
"name": "Fertilisation",
"value": 27840,
"label": {
"show": true,
"position": "inside",
"overflow": "break"
},
"children": []
},
{
"name": "Produits de traitements",
"value": 39040,
"label": {
"show": true,
"position": "inside",
"overflow": "break"
},
"children": []
},
{
"name": "Travaux par tiers",
"value": 9760,
"label": {
"show": true,
"position": "inside",
"overflow": "break"
},
"children": []
}
],
"itemStyle": {
"color": "#F28960",
"borderWidth": 1
}
},
{
"name": "Charges de structure\n272000 €",
"value": 272000,
"label": {
"show": true,
"position": "inside",
"overflow": "break"
},
"children": [
{
"name": "Carburant",
"value": 10560,
"label": {
"show": true,
"position": "inside",
"overflow": "break"
},
"children": []
},
{
"name": "Entretien matériel",
"value": 34880,
"label": {
"show": true,
"position": "inside",
"overflow": "break"
},
"children": []
},
{
"name": "Eau, gaz, électricité",
"value": 2300,
"label": {
"show": true,
"position": "inside",
"overflow": "break"
},
"children": []
},
{
"name": "Frais de gestion",
"value": 11000,
"label": {
"show": true,
"position": "inside",
"overflow": "break"
},
"children": []
},
{
"name": "Fermage",
"value": 47360,
"label": {
"show": true,
"position": "inside",
"overflow": "break"
},
"children": []
},
{
"name": "Assurances",
"value": 30720,
"label": {
"show": true,
"position": "inside",
"overflow": "break"
},
"children": []
},
{
"name": "Autres",
"value": 135180,
"label": {
"show": true,
"position": "inside",
"overflow": "break"
},
"children": []
}
],
"itemStyle": {
"color": "#F5A893",
"borderWidth": 1
}
},
{
"name": "Charges de personnel\n16000 €",
"value": 16000,
"label": {
"show": true,
"position": "inside",
"overflow": "break"
},
"children": [
{
"name": "Salariés",
"value": 16000,
"label": {
"show": true,
"position": "inside",
"overflow": "break"
},
"children": []
}
],
"itemStyle": {
"color": "#FDCF74",
"borderWidth": 1
}
},
{
"name": "Soldes de gestion\n248200 €",
"value": 248200,
"label": {
"show": true,
"position": "inside",
"overflow": "break"
},
"children": [
{
"name": "Prélèvements privés",
"value": 50000,
"label": {
"show": true,
"position": "inside",
"overflow": "break"
},
"children": []
},
{
"name": "EBE total",
"value": 198200,
"label": {
"show": true,
"position": "inside",
"overflow": "break"
},
"children": []
}
],
"itemStyle": {
"color": "#F8B26D",
"borderWidth": 1
}
}
]
}
},
"2022": {
"Produits": {
"name": "Produits 2022\n661000 €",
"value": 661000,
"type": "treemap",
"breadcrumb": {
"height": 34,
"itemStyle": {
"textStyle": {
"lineHeight": 15
}
}
},
"data": [
{
"name": "Chiffre d'affaire\n598000 €",
"value": 598000,
"label": {
"show": true,
"position": "inside",
"overflow": "break"
},
"children": [
{
"name": "Vente de produits végétaux",
"value": 598000,
"label": {
"show": true,
"position": "inside",
"overflow": "break"
},
"children": []
}
],
"itemStyle": {
"color": "#afd095",
"borderWidth": 1
}
},
{
"name": "Aides\n63000 €",
"value": 63000,
"label": {
"show": true,
"position": "inside",
"overflow": "break"
},
"children": [
{
"name": "DPU, DPB",
"value": 60000,
"label": {
"show": true,
"position": "inside",
"overflow": "break"
},
"children": []
},
{
"name": "Aide à la certification",
"value": 3000,
"label": {
"show": true,
"position": "inside",
"overflow": "break"
},
"children": []
}
],
"itemStyle": {
"color": "#729fcf",
"borderWidth": 1
}
}
]
},
"Charges": {
"name": "Charges 2022\n711000 €",
"value": 711000,
"type": "treemap",
"breadcrumb": {
"height": 34,
"itemStyle": {
"textStyle": {
"lineHeight": 15
}
}
},
"data": [
{
"name": "Charges opérationnelles\n118720 €",
"value": 118720,
"label": {
"show": true,
"position": "inside",
"overflow": "break"
},
"children": [
{
"name": "Semences et plants",
"value": 27200,
"label": {
"show": true,
"position": "inside",
"overflow": "break"
},
"children": []
},
{
"name": "Fertilisation",
"value": 44480,
"label": {
"show": true,
"position": "inside",
"overflow": "break"
},
"children": []
},
{
"name": "Produits de traitements",
"value": 37440,
"label": {
"show": true,
"position": "inside",
"overflow": "break"
},
"children": []
},
{
"name": "Travaux par tiers",
"value": 9600,
"label": {
"show": true,
"position": "inside",
"overflow": "break"
},
"children": []
}
],
"itemStyle": {
"color": "#F28960",
"borderWidth": 1
}
},
{
"name": "Charges de structure\n279360 €",
"value": 279360,
"label": {
"show": true,
"position": "inside",
"overflow": "break"
},
"children": [
{
"name": "Carburant",
"value": 10560,
"label": {
"show": true,
"position": "inside",
"overflow": "break"
},
"children": []
},
{
"name": "Entretien matériel",
"value": 19200,
"label": {
"show": true,
"position": "inside",
"overflow": "break"
},
"children": []
},
{
"name": "Eau, gaz, électricité",
"value": 9000,
"label": {
"show": true,
"position": "inside",
"overflow": "break"
},
"children": []
},
{
"name": "Frais de gestion",
"value": 98000,
"label": {
"show": true,
"position": "inside",
"overflow": "break"
},
"children": []
},
{
"name": "Fermage",
"value": 39680,
"label": {
"show": true,
"position": "inside",
"overflow": "break"
},
"children": []
},
{
"name": "Assurances",
"value": 17920,
"label": {
"show": true,
"position": "inside",
"overflow": "break"
},
"children": []
},
{
"name": "Autres",
"value": 85000,
"label": {
"show": true,
"position": "inside",
"overflow": "break"
},
"children": []
}
],
"itemStyle": {
"color": "#F5A893",
"borderWidth": 1
}
},
{
"name": "Charges de personnel\n20000 €",
"value": 20000,
"label": {
"show": true,
"position": "inside",
"overflow": "break"
},
"children": [
{
"name": "Salariés",
"value": 20000,
"label": {
"show": true,
"position": "inside",
"overflow": "break"
},
"children": []
}
],
"itemStyle": {
"color": "#FDCF74",
"borderWidth": 1
}
},
{
"name": "Soldes de gestion\n292920 €",
"value": 292920,
"label": {
"show": true,
"position": "inside",
"overflow": "break"
},
"children": [
{
"name": "Prélèvements privés",
"value": 50000,
"label": {
"show": true,
"position": "inside",
"overflow": "break"
},
"children": []
},
{
"name": "EBE total",
"value": 242920,
"label": {
"show": true,
"position": "inside",
"overflow": "break"
},
"children": []
}
],
"itemStyle": {
"color": "#F8B26D",
"borderWidth": 1
}
}
]
}
}
}
Histogram
This chart allows you to display a simple histogram like the one below. The columns can typically be years but can also be anything else.
Radar
A radar with any number of branches. We can put an average there to compare with the results of a group of farms for example. The maxes of each branch may not all be the same.
The radar, as well as all other graphics, can be positioned on the right, on the left, or centered on the page.
Rotation
A graph to display a rotation. Each element of the rotation extends over a given number of months, and you can specify any additional element in comments (by hovering the mouse or clicking on it on mobile). As on each graph, the colors are chosen directly in Google Spreadsheet™.
Crop surface distribution
The rotation allows us to show how the farmer's useful surface area is distributed between his different productions at a given time.
Environmental analysis and socio-economic analysis
legend: { }, radar: { indicator: [ { name: 'Taux de MO', max: 6, min: 1.5}, { name: 'Couverture de sol', max: 100}, { name: 'Biodiversité ', max: 60 }, { name: 'Non travail du sol', max: 100}, { name: 'Absence\nde chimie', max: 100}, { name: 'Nombre d\'espèces\ncultivées', max: 30}, ] }, series: [ { type: 'radar', data: [ { value: [ 3.6, 100, 60, 100, 100, 30, ], name: "Nom de la ferme", emphasis: { label: { show: true } }, itemStyle: {width : 3, color: "#f1894c" }, lineStyle: {width : 3, color: "#f1894c" }, areaStyle: {color: "#f1894c" } }, { value: [ 4.9, 97, 52, 70, 100, 30, ], name: 'Moyenne MSV', emphasis: { title: { show: true }, label: { show: true } }, lineStyle: {width : 3} } ] } ]
};- Taux de matière organique : Entre 1,5 et 8% de taux de matière organique.[1]
- Nombre d'espèces cultivées : 100% au delà de 30 espèces cultivées sur la ferme.
- Absence de chimie : 100% quand la ferme est en bio.
- Non travail du sol : % de la SAU qui n'est jamais travaillée.
- Biodiversité : Pourcentage de la surface d'intérêt écologique sur la SAU.
- Couverture de sol : 100% quand moins de 10 jours de sols nus dans l'année - 0% au delà de 150 j/an.
These radars allow you to display the data found in MSV portraits for example.
Self-production capacity
 title: {
     text: "Part produite sur place (en % du total)"
 },
 legend: {
   top: "20"
 },
 grid: {
   containLabel: true
 },
 xAxis: [
   {
     type: 'value',
     min: 0,
     max: 100,
   }
 ],
 yAxis: [
   {
     type: 'category',
     data: ["MO", "Légumes", "Plants", "Semences"],
   }
 ],
 series: [
   {
     name: "Nom de la ferme",
     emphasis: { label: {show: true, formatter: '{a} : {c}%'} },
     type: 'bar',
     data: [10, 100, 90, 3]
   },
   {
     name: 'Moyenne',
     type: 'bar',
     emphasis: { label: {show: true, formatter: '{a} : {c}%'} },
     itemStyle: {
       normal: {
         color: '#ddd'
       }
     },
     data: [19 , 85 , 72 , 7 ]
   }
 ]
};This graph allows you to display the self-production capacity of the farm on certain aspects (used in particular in farm portraits).
Commercial strategy
 tooltip: {
   trigger: 'item',
   formatter: '{b} : {d}%'
 },
 legend: {
   orient: 'vertical',
   left: 'left',
   top: 'center'
 },
 series: [
   {
     type: 'pie',
     radius: ['40%', '70%'],
     center: ['65%', '50%'],
     label: {
       show: true,
       position: 'inside'
     },
     data: [
      { name: "Paniers", value: 20 },

      { name: "AMAP", value: 30 },

      { name: "Vente à la ferme", value: 23 },


      { name: "Grossiste", value: 17 },
      { name: "GMS", value: 10 },

      { name: "Autres", value: -2.220446049250313e-14 },
     ]
   }
 ]
};This pie chart allows you to understand the share of farm income based on the different sales channels.
Installing the Add-on
Adding graphics to Triple Performance is done via a Google Spreadsheet™ add-on that can be downloaded from the Google Workspace Marketplace by clicking on the following button:
-
 The add-on must first be installed from the "Google Workspace Marketplace" by going to this page: https://workspace.google.com/marketplace/app/triple_performance/427792115089.
 -
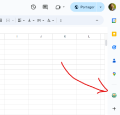 Once installed, the Triple Performance icon should appear on the right when you are on a Google Spreadsheet™ document (NB: The sidebar with Add-on icons can be shown or hidden with a small chevron at the bottom right).
 -
 The next step is to create an account on Triple Performance if you haven't already done so.
 -
 Don't forget to validate the account via the email received
 -
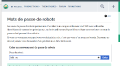 Once logged into Triple Performance, you must go to the Special:BotPasswords page. This page allows you to create a special username and password for using the Add-on. In "Robot name", put for example "Add-on", then click on "Create".
 -
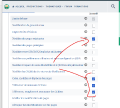 Check the boxes: "Edit existing pages", "Create, modify and move pages", "Upload new files" and "Upload, replace and rename files", then click on "Create"
 -
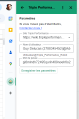
 Finally, copy the username and password thus created. The username must have the following form:
Guy Delucas (2788345452)@Add-onand the password a long string of numbers and characters:pj6mlndh72495qurih489noeh6o2bn6l -
 Return to the Add-on (Google Spreadsheet), and click on the “Settings” button at the bottom of the Add-on.
 -
 Enter the username and password previously created, then click on “Save settings”. If you get an error, check that you haven't forgotten a character in the username or password.


Adding a chart to a Google Spreadsheet document
- Start by going to a new tab.
- Click on the chart you want to create. A table will be added at the end of the current tab.
- When adding the first graph, a new tab "General data' will be added. This tab can be used to store any information about the farm studied, but is especially important to know the name of the page to which the new graphics should be inserted.
- Create, if not already done, the Triple Performance page for the farm portrait, giving it the name of the farm (for example
EARL of the Great Woods). The same principle applies to any page, you can also insert graphics into any page (technical route, etc.). The page must exist before syncing the first chart! - Enter the name of the page in cell B1 of the "General Data" tab, opposite the cell marked "Triple Performance Page Name". When you synchronize the graphics, they will be sent to this page.
- Create, if not already done, the Triple Performance page for the farm portrait, giving it the name of the farm (for example

- Now complete/edit the chart, completing/editing the data in the table that was created previously.
- Click the blue button at the bottom of the “Synchronize page” add-on.
- Choose the chart to sync.
- Click "Sync Chart".
- Go to the Triple Performance page, and reload there to see that the graph has been added.
Frequently asked questions
- I edited the chart and resynced it, but it remains unchanged in Triple Performance?
The previous graph was cached (for performance reasons). Go to the menu on the right of the page and select "Purge page".
- In the rotation graph, I cannot return to the line in the comment cells!
Simply click Ctrl-Enter to move to a line within a cell. You can also add bold, italics, etc... with the keyboard shortcuts: Ctrl-b, Ctrl-i, ...
- I changed the title of my Triple Performance page, should I also change the name in the "General data" tab?
Yes, the name in front of “Triple Performance Page Name” must always match the title of the Triple Performance page
- Can I add other texts in the "General data" tab?
Yes, the important thing is that somewhere in the tab, we have the two cells in column A "Triple Performance page name" and B with the title of your page.
- I'm trying to sync an X or Y chart, but it's not showing in Triple Performance
Check that you have not modified any texts necessary for the Add-on to find your way... In particular, the Add-on will look for the line with "Graphic" written and the type of graphic in the cell following. This is how it recognizes this or that type of graph. If you modify this text, synchronization is no longer possible. It is the same with the texts "End of graph", etc... If necessary, add a new graph of the same type by clicking on the corresponding button, and report the values one by one to understand when it stops to work !
- In the economic balance sheet graph, is it possible to add other fields (for example metric expenditure, etc.)?
No unfortunately, all the fields managed by this chart are displayed by default when you add the chart to your Spreadsheet. You can delete lines that are unnecessary but you cannot create new ones. The same goes for analytical radars, self-production capacity and business strategy. If you see fields that would be interesting to add, contact us!
- I have a problem that is not on the list?
No worries, we are responsive. The best thing is to go to Slack and ask us directly!
- ↑ Dans l'analyse de terre, la matières organiques (MO) est quantifiée à partir du dosage de la teneur en carbone organique (C) son constituant majeur, que l'on multiplie par un coefficient censé refléter la teneur en carbone de la MO, qui peut différer selon les laboratoires Français : 1.72 ou 2. Ce coefficient est toujours précisé sur les bulletins d'analyse. Il est donc nécessaire de vérifier le coefficient utilisé si on change de laboratoire pour éviter une interprétation erronée de l'évolution de la teneur en MO.